Integrated Catchment Management
Integrated Catchment Management
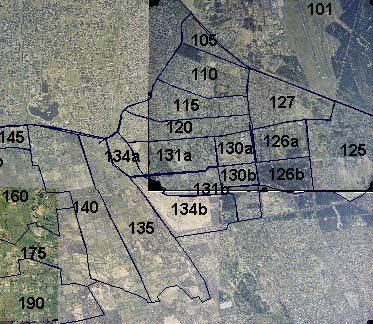
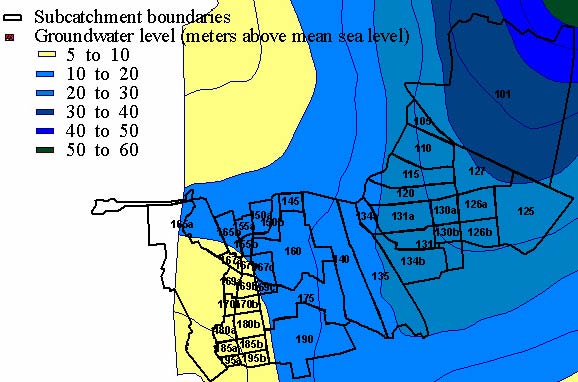
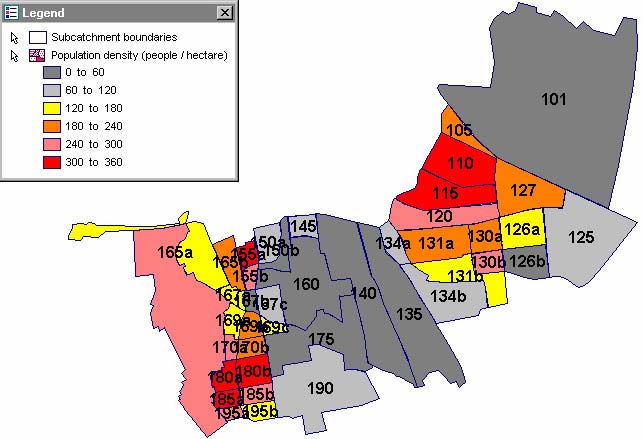
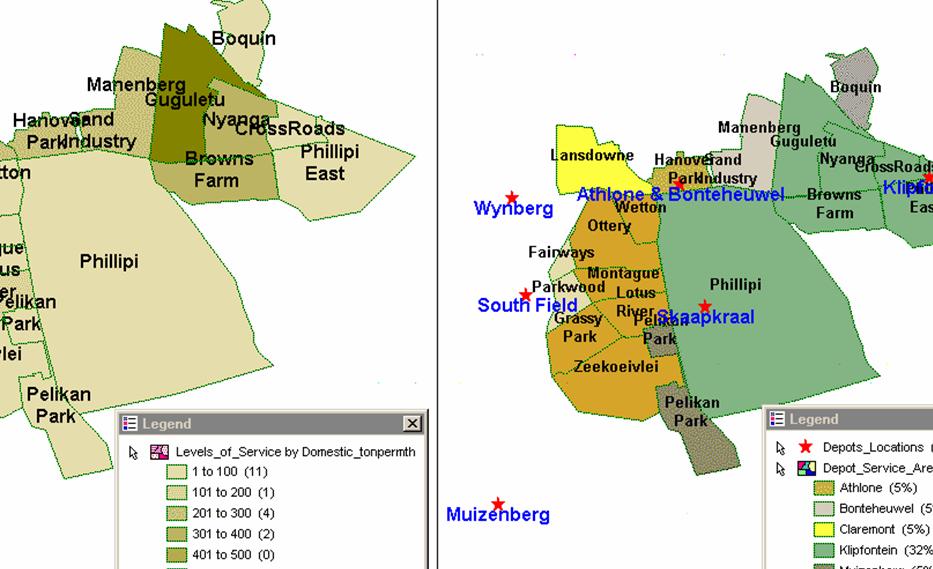
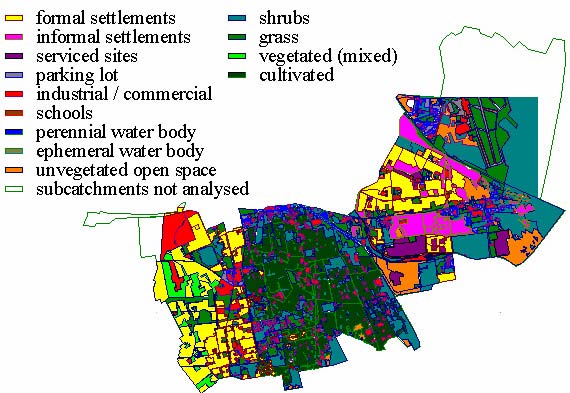
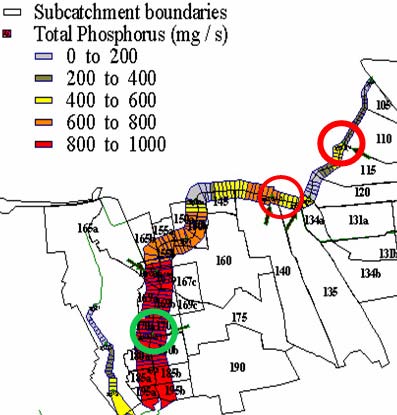
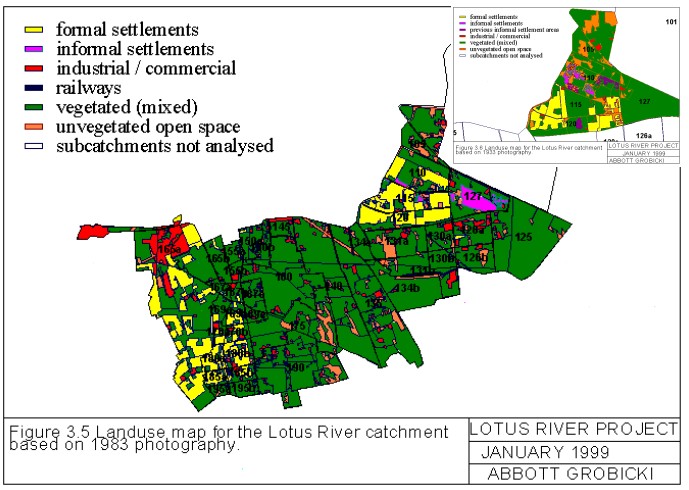
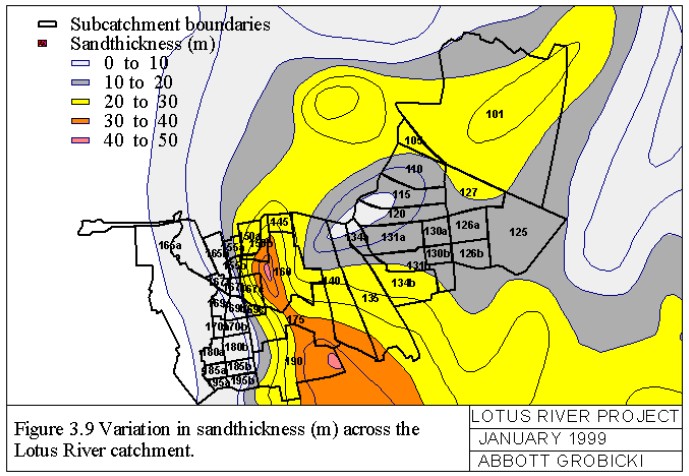
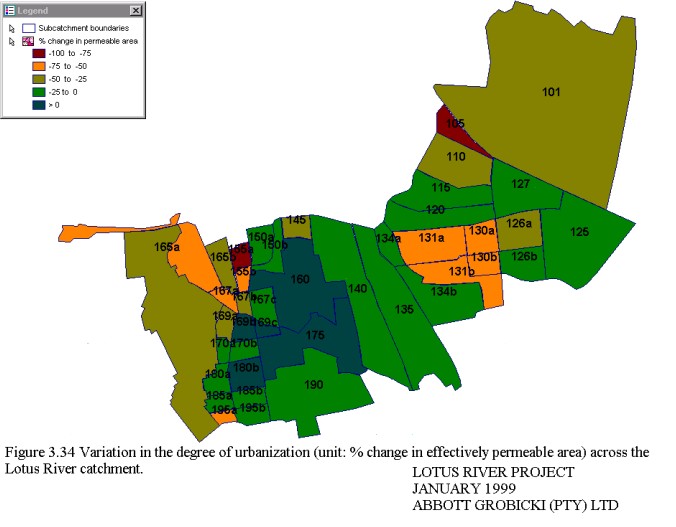
In the area of integrated catchment management I have utilized GIS to analyze the variation in hydro-geochemical / water quality variables along a polluted river with respect to the associated groundwater, waste disposal, land use and other catchment data. Thematic maps were created illustrating the variation in: the underlying aquifer properties (salinity, groundwater level, transmissivity, saturated sandthickness), water quality variables monitored along the river (total oxygen demand, phosphorous, suspended solids, chemical oxygen demand),catchment characteristics (population, land use,urbanization) and the location of other features (cleansing depots, recycling facilities) . This work was carried out for the Water Research Commission of SA. Shown here are images from Lotus river catchment GIS. These include: sub-catchment boundaries on Aerial photography Land use map for 1996, Groundwater level variation, Population density,Total Phosphorus variation, Levels of Service and locations of depots.
|