|
Kimberlites
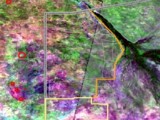
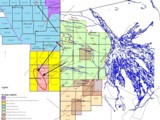
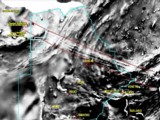
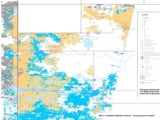
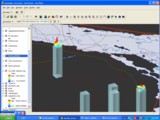
Several forms of imagery can be used when setting up a Geographic Information System (GIS) for targeting diamondiferous kimberlites. These include amongst other types: Landsat, radarsat, ASTER, Hyperion and other forms of hyper- and multi-spectral satellite data, aeromagnetic, gravity, elevation, soil geochemistry data etc.. In addition to working with these and other data types I have also been involved in delineating prospecting license (PLs) polygons, the results of soil surveys / loam sampling surveys, previous exploration results, topographic and other vector data sets. This has facilitated thematic mapping of garnet, ilmenite, micro-diamond and other kimberlite minerals (KIMs) and soil index path-finder analyses. Within the Spatial Analyst environment, I have applied simple Kriging and Spline contouring techniques to geochemical and geophysical data and determined mineral ratios as defined by the ASTER data user manual.
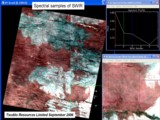
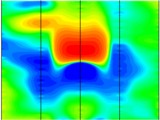
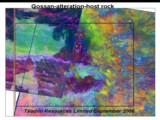
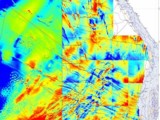
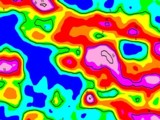
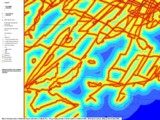
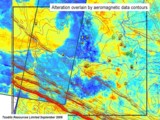
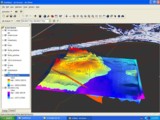
I have also done some preliminary work on reclassifying data and applying map algebra / grid-based calculations to determine weighted geochemical trace metal indices. These images illustrate examples of the types imagery that can be incorporated into an exploration GIS. Also shown are the results of contouring and surface modeling algorithms applied to geochemical and geophysical field grid data. Other types of analyses available include:
- Landsat satellite imagery spectral analysis
- ASTER satellite data mineral ratio calculations
- Aeromagnetic gradient analysis
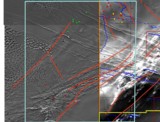
- Fault and lithological boundary proximity analysis
Based on graphical and quantitative spectral analyses it is possible to prioritize promising kimberlite targets and define zones of greater likelihood for bearing kimberlites. The aeromagnetic gradient is another feature that may be used to characterize kimberlite targets. Other data types that may be of use to overlay when planning a drilling program include: Bouger anomaly gravity data, paleochannel data, loam samples data, KIM occurrences and other geological data. Where it is believed that the distribution of kimberlites is associated with faults and / or lithological boundaries, a proximity analysis may be carried out to characterize potentially kimberlite-bearing zones. Further examples can be seen at:
- http://www.tsodiloresources.com/s/Imagery.asp
|